Methods
to determine subexposure durations for CCD imaging have
received a great deal of attention.
John Smith has
developed a subexposure
calculator based upon the need to reduce the camera's read noise
component by overwhelming it with sky noise. I have approached
this problem from a different angle,
asking what subexposure duration is needed to maximize the signal
to noise ratio of the final cumulative exposure. Even
though the final equations are different, the results are similar to
John's, but conceptually I find this approach more intuitive. The
math is straightforward and graphs are provided to illustrate the
points (I
suggest right-clicking on the graph links to open them in a separate
window). At the end,
I provide a link to an Excel Spreadsheet that you may use to calculate
subexposure duration at your own site.
The signal
to noise ratio per pixel, for a single sub, is expressed as follows
(ignoring
the contribution from dark noise):
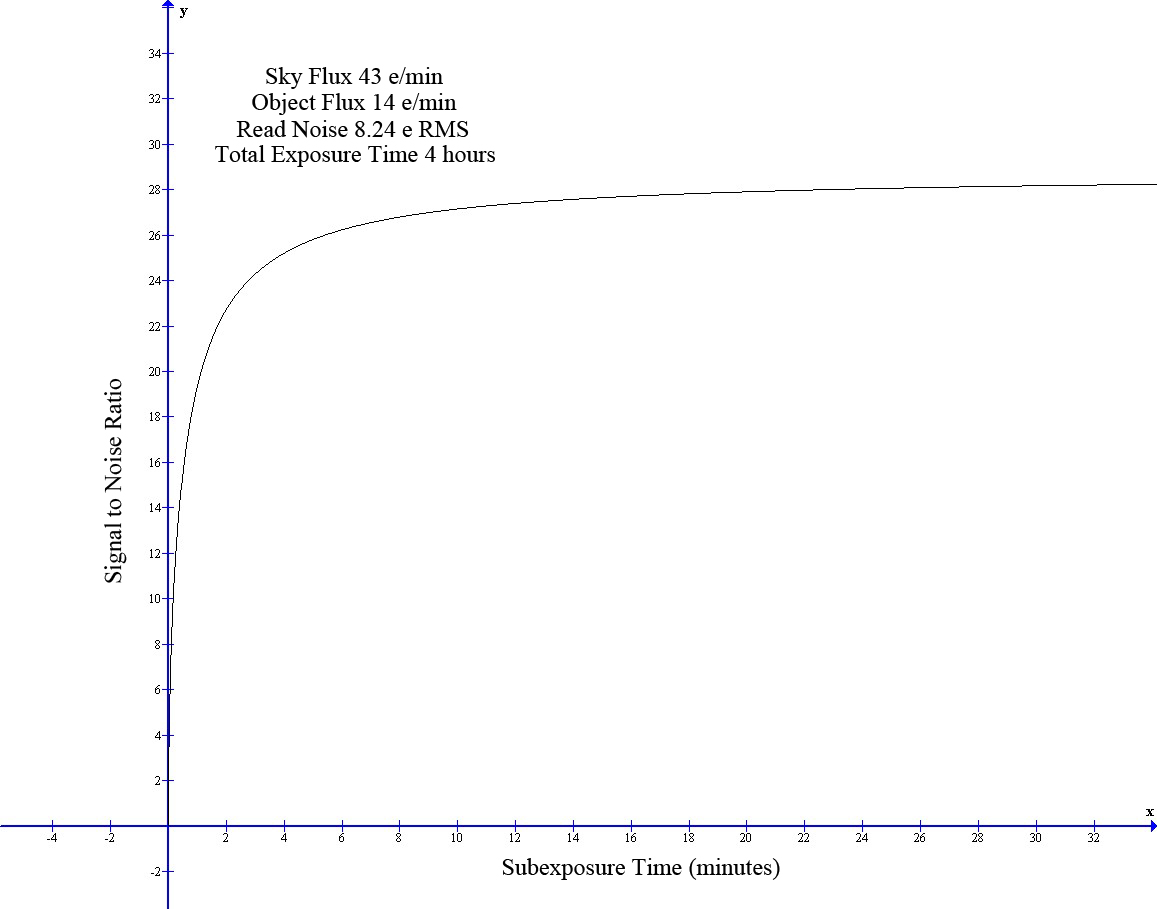
1. SNR (for single sub) = (Obj)*tsub /
sqrt[(Sky+Obj)*tsub + R2]
where SNR
= signal to noise ratio per pixel; Obj = object flux in
electrons/pixel/minute; Sky =
sky flux in electrons/pixel/minute; tsub = subexposure time
in
minutes; R = read noise in e RMS.
2. By combining N
exposures, the noise per pixel becomes:
Noise (Tot)
= sqrt[N*{(Sky+Obj)*tsub
+ R2}] / N
Therefore, by combining N exposures, the SNR (Tot) per pixel becomes:
SNR (Tot) = N*(Obj)*tsub
/
sqrt[N*{(Sky+Obj)*tsub + R2}]
where SNR(Tot) refers to
SNR per
pixel in the
total exposure (assumes
an average, median, or
sigma reject combine for the signal component); N = number of
subexposures.
3. Simplifying, this becomes SNR (Tot)
= sqrt[N]*(Obj)*tsub /
sqrt[(Sky+Obj)*tsub + R2]
4. Let K = total exposure time, which equals N*tsub.
So N = K / tsub
5. Substituting K / tsub for N in equation 3: SNR
(Tot) = sqrt[K / tsub]*(Obj)*tsub /
sqrt[(Sky+Obj)*tsub + R2]
6. SNR
(Tot) = sqrt[K*tsub]*(Obj) /
sqrt[(Sky+Obj)*tsub + R2]
7. This yields the following representative graph
of SNR versus subexposure duration for a fixed total exposure K (4
hours in this example). The values are chosen to represent a
faint Ha emitting object at my imaging site, with the Maxcam CM10 (R=
8.24 e
RMS). Note that the curve rises rapidly over a short span of
subexposure times, and then flattens out. In this example, the
gains
in SNR for subexposure times beyond 10 minutes are minimal. As indicated below, it can
be shown that the curve starts to plateau when the photon noise
contribution dominates the read noise.
8. The curve predicted from equation 6 has an asymptote that can
be easily calculated as
subexposure time approaches infinity. Specifically, as
subexposure time
approaches infinity, the contribution of R becomes negligible, and this
factor can be ignored in determining the asymptote. The equation becomes:
SNR
asymptote = sqrt[K]*(Obj)
/ sqrt[(Sky+Obj)]. Thus, in photon
noise limited conditions, the SNR is minimally affected by the read
noise or subexposure duration (i.e., assuming that the subexposure
duration is sufficiently long).
9. Here is a graph
that shows the asymptote for the previous example, along with a new
metric that I refer to as "F". F is the fraction of the maximum
SNR (at asymptote)
achieved at a given subexposure time. In this example, a value of
0.9 is chosen, along with its corresponding subexposure time
(x-axis). The choice of 0.9 is arbitrary- as long as the F value
is a sizable fraction of the maximum achievable SNR (e.g., F greater
than or equal to 0.9, for instance), the subexposure time should be
fine.
10. It is easy to calculate the subexposure time for a desired
value of F. F = SNR(Tot) / SNR (asymptote), which is derived
further in
equation 11 below.
11. F = (sqrt[K*tsub]*(Obj) /
sqrt[(Sky+Obj)*tsub + R2])
/ (sqrt[K]*(Obj)
/ sqrt[(Sky+Obj)])
12. Solving for tsub: tsub = F2*R2
/ [(Sky+Obj)*(1-F2)]. For Sky >> Obj, the
equation becomes tsub = F2*R2
/ [Sky*(1-F2)], where F is the desired fraction of maximum
SNR you wish to achieve, R is
the read noise (e RMS), and Sky is the sky flux (e/minute). This
equation has similarities to the one derived by John, but it is not the
same.
13. Note that the subexposure time is related to the square of
the read noise, which makes having a low read noise camera ideal.
Here is a representative
graph showing this relationship. Even a small increase in
read noise can significantly increase subexposure time.
14. As mentioned in point #7 above, the SNR curve rises
quickly, and there is little to be gained beyond a certain subexposure
duration. However, the shape of the curve (specifically how fast
it
flattens out) is dependent upon the sky noise level, as shown in the following graph,
which demonstrates the relationship between SNR and subexposure time as
a
function of sky flux.
Notice that the curve rapidly approaches the asymptote in a relatively
light polluted site (sky
flux through an Ha 6nm filter of 43 e/min), and but takes longer to do
so at a dark site (sky flux
2
e/min, used for
illustrative purposes only). Because of this effect, the dark site
requires a longer subexposure to achieve an F value of 0.9
(in this example).
15. Feel free to download my Excel
spreadsheet that will allow you to calculate your subexposure
time based upon this analysis. I developed this spreadsheet, and
then Neil
Fleming added some nice frills, including a camera drop down button
and a blue background (thanks Neil!). A few things to note when
using the spreadsheet:
A. Measuring the Sky ADU is
the most important user-defined parameter. On a moonless
night, choose a region of sky near the zenith that is free of large
nebulae or galaxies that might obscure background sky. Take an image for 3
minutes, and then calibrate it (dark frame and flats). Use
this calibrated image to measure the Sky ADU value. For instance,
in Maxim you could use the annulus tool to measure the average ADU in
an area of the image free of nebulae or stars. Get a few readings
from different parts of the background and average them together to get
a representative value.
B. The manufacturer-determined
camera gain and read noise values are automatically chosen for you in
this spreadsheet. This will get you very close, but the
spreadsheet will also allow you to insert other values if the measured
gain and read noise for your camera differs. John Smith describes
the procedure for determining your camera's gain and read noise on his webpage,
and AIP4WIN software will also do this for you.
C. This spreadsheet will work for
the conditions of your set up at any given time. It takes into
account your binning value or choice of filter, in the sense that the
measured Sky ADU value will be self-correcting for this. For
instance, if you bin 2x2, your measured Sky ADU will be higher, and
your calculated subexposure duration will be lower. Likewise, if
you are using an Ha filter, your measured Sky ADU will be lower, and
your calculated subexposure duration will be higher. So don't
worry about any of this, except to note that your calculated
subexposure duration needs to be determined for a given set of
conditions (binning, filter, f ratio, camera, imaging site,
etc.). If these change, you
need to remeasure the Sky ADU and obtain a more relevant subexposure
duration for your new conditions.
D. Many software packages,
including Maxim, will add a value of 100 ADU to the calibrated image
(i.e., the image that you will use to measure the Sky ADU). This
means that a value of 100 must be subtracted from the measured ADU in
order to obtain an accurate determination of Sky Flux. Depending
upon the software that you choose in the drop down menu, my spreadsheet
will automatically subtract this out, so you don't have to worry about
it.
Please note that you use this at
your own risk, and I take
no responsibility for problems that this may cause with your computer,
etc. If you find this analysis interesting, please feel free to
refer others to this link.
Steve
Home