M3 (NGC 5272)- Light curve from an RR Lyrae star
Description:
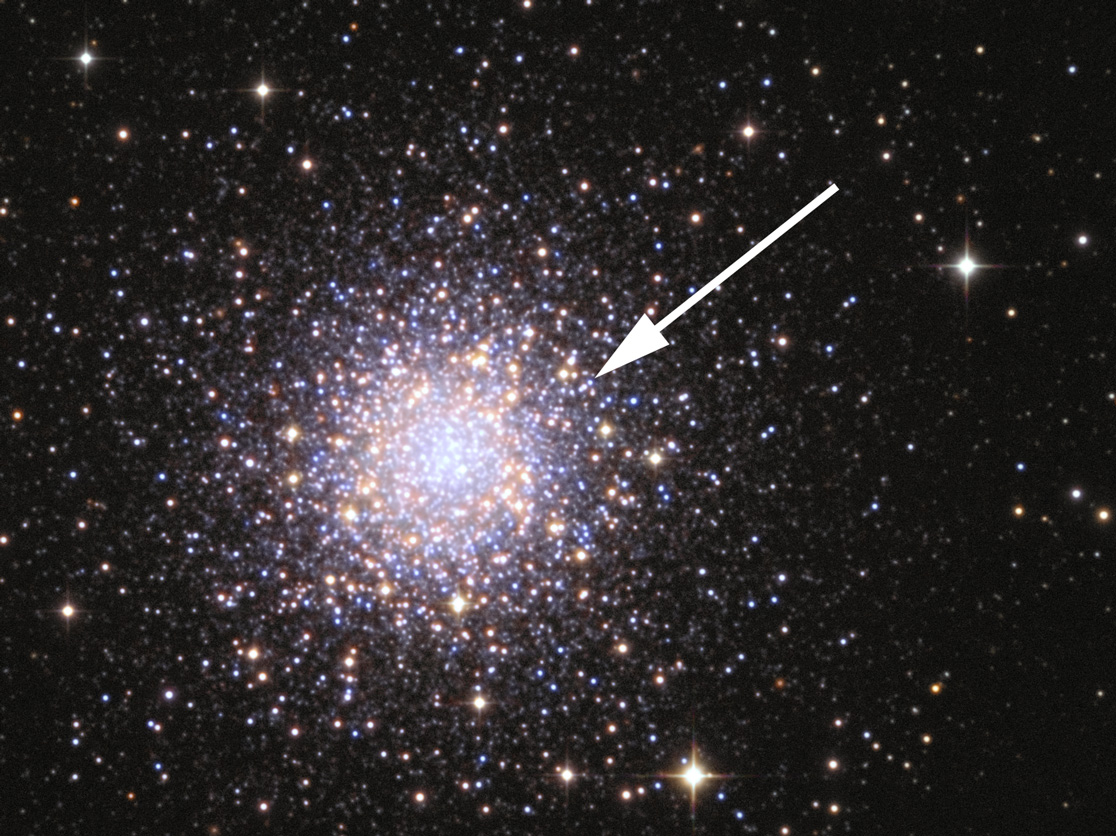
In the top panel, the arrow points to one of several RR Lyrae stars
that clearly fluctuated in intensity over the course of the imaging
session.
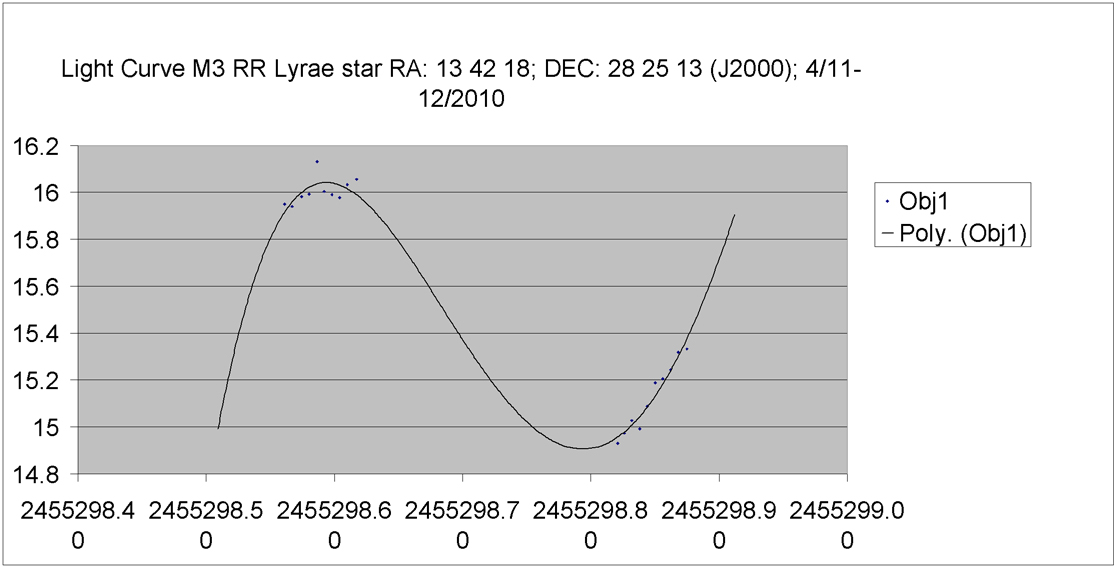
Using the photometry tool in MaximDL and identifying a reference
(non-variable) star, I quantitated the magnitude of this RR Lyrae star
over time using sequential, calibrated luminance subs, with the results
plotted in the lower Excel graph. The missing segments are
due to intervening RGB subframes that were taken throughout the night
(I
did not plan to generate a light curve!). I used a polynomial
curve fit (3rd order) to estimate the dimensions of the curve, yielding
an average relative magnitude
for this variable of 15.55. An accepted
value
for the absolute magnitude of
RR Lyrae stars is approximately
0.75. Using the distance modulus equation (d =
10^[0.2*(m-M+5)],
where d is the distance in parsecs, m is the average relative
magnitude, and M is the absolute magnitude), I calculated a distance of
9120 parsecs, or 29,731 light years for the M3 globular cluster (3.26
LY/parsec). Having used only one RR Lyrae star and an
incomplete light curve, this is in remarkably close agreement with the
accepted distance of 33,900 light years.
Please
note: Graphics on this website may not be reproduced without
author permission.
Back to Star
Clusters
Home