M3 Herztsprung-Russell Diagram (with rollover)
Characteristics:
Distance: 33,900 light years
RA: 13h 42m 09s
Dec: +28 degrees 22' 09"
PA: plus 90 degrees
Methods:
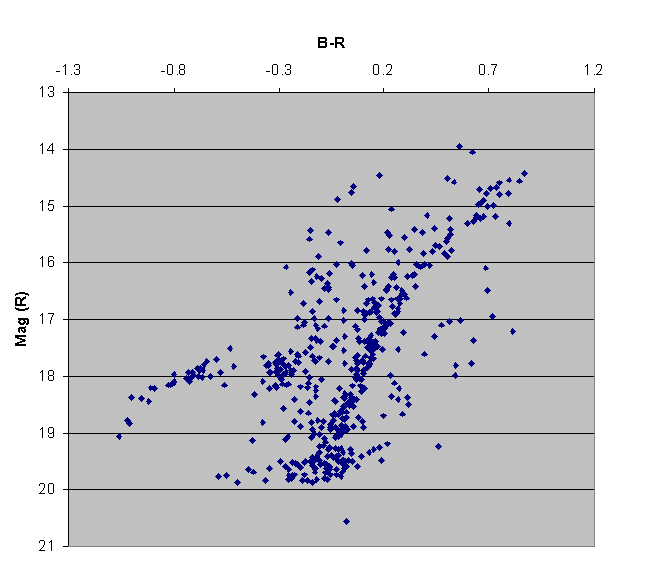
This is an HR diagram of M3 that I constructed using my own data from
the red and blue subexposures obtained for my image of M3, using
the "Extractive Photometry Tool" in AIP4WIN v2.3.1. I opened the
calibrated red and blue images in
AIP4WIN, activated the Extractive Photometry Tool (Measure- Photometry-
Extractive Photometry Tool) and added the following baseline
information:
Sensitivity- "ultra-low"; Report- Column separator, "tabs"; Limits-
separation in pixels = "30" (you will have to experiment with this,
depending upon the density of stars in your image); Settings- insert
values as indicated, the most important being the integration time for
red and blue images, respectively. Once the extraction is
complete, I saved the data as a text
file and imported it into Excel, reviewing row by row to weed out
extraneous "hits" in one color that did not correspond to the other
color, ultimately yielding a total of 546 star pairs for each group
(red and blue) to perform the analysis. This took a fair amount
of time and patience. I then subtracted the red magnitude values
from the blue magnitude values, yielding B-R values that were plotted
on the x-axis of the HR diagram, against the associated red magnitude
values on the y-axis, using the scatter plot graph function in
Excel. The axes direction and range needed to be adjusted in
order to yield the graph shown above. Note that I used B-R as
opposed to B-V, because I didn't obtain these images through a V
filter, and because B-R would yield the greatest separation in
magnitude values and therefore provide the greatest discrimination of
color over the blue through red spcctrum. This strategy was also
used by Robert Vanderbei as described in a recent Sky and Telescope
article ("Sequencing the Stars," S+T, December 2010, pages 30-34).
Comment:
This
technique was surprisingly effective at yielding an HR diagram that is
quite characteristic of an old globular cluster. Place your mouse
over the above image to see labels that identify the various features
of this HR diagram, which I describe in greater detail in my image of M13.
Note the turn off point, the red giant and supergiant arm, the
horizontal branch stars, and the gap produced by the variable
magnitudes of RR Lyrae stars. Note that a residual tail of
long-lived, Main Sequence
stars should be present in the lower right hand portion of
this graph, but it is not observed- I suspect that these very dim stars
were not
captured reproducibly in my image, and/or were not detected by the
extractive photometry tool, at least not using the settings
above. I am certain that my technique could be better optimized
to generate a more complete curve, but as a "proof of principle"
exercise, I had fun.
For anyone interested in playing with the data used to generate the
above HR diagram, you may download my Excel files here: Red file;
Blue file .
Note: I am providing these data for interested amateur
astrophotographers but apologize in advance if I don't have time to
answer any questions that you might have regarding how to use them,
beyond what I've explained above. Sorry...
Photographic
Details for the original M3 image (link under the image):
Date: April 11, 2010
Scope: Vixen VC200L at f6.4 on the
Takahashi NJP
Mount
Autoguider: SBIG ST-402
Camera: ST8300 -20C
Filters: Astronomik
Clear (unblocked), R, G, B filters
Exposures: Clear- 60 x 2' =
120'; R- 10 x 7'; G- 6 x 10'; B-
6 x 15'. Total exposure 5.7
hours
Post-processing:
Calibrated in Maxim, aligned and
stacked using DeepSkyStacker, followed
by DDP
in ImagesPlus (IP). Further processing in Photoshop CS4.
Please
note: Graphics on this website may not be reproduced without
author permission.
Back to Star
Clusters
Home